

From February to August 2026, our research team pulled trucking insurance rate data from ATRI, Progressive Commercial, Insureon, The Zebra, and FMCSA to build a weighted model that turns per-mile and per-policy numbers into one consistent monthly figure.
What we found was that trucking insurance runs $650 to $2,500 a month, depending on your coverage, fleet size, vehicle, and driving record. Most single-truck operations carrying a full package (liability, cargo, and physical damage) land between $900 and $1,600 a month. The trend line only moves one way: up. The reason isn’t more accidents. It’s bigger court verdicts. The sections below further break down where these numbers come from and what moves them.
Average Monthly Cost by Coverage Type: 2026
The table below breaks out the average monthly cost per truck and what pushes the price up or down.
| Coverage Type | Average Monthly Cost | Annual Cost Range | Cost Driver |
|---|---|---|---|
| Primary Liability | $650 – $1,350 | $7,800 – $16,200 | FMCSA’s $750,000 federal minimum for general freight, though most brokers require $1,000,000; rising nuclear verdict exposure (jury awards of $10 million or more); your operating radius; how long you’ve held authority |
| Motor Truck Cargo | $70 – $150 | $840 – $1,800 | Commodity type, since refrigerated and high-theft freight cost more than dry van; declared cargo value; deductible; claims history |
| Physical Damage | $80 – $450 | $960 – $5,400 | Truck age and value; deductible chosen, commonly $1,000 to $5,000; garaging ZIP code theft and weather risk |
| Bobtail / Non-Trucking Liability | $20 – $60 | $240 – $720 | Garaging state; driver record; the exact lease agreement wording; whether it’s bundled with physical damage |
| General Liability | $35 – $100 (avg. $51) | $420 – $1,200 | Claims history; policy limits, since 96% of buyers choose $1,000,000/$2,000,000; whether it’s bundled into a business owner’s policy |
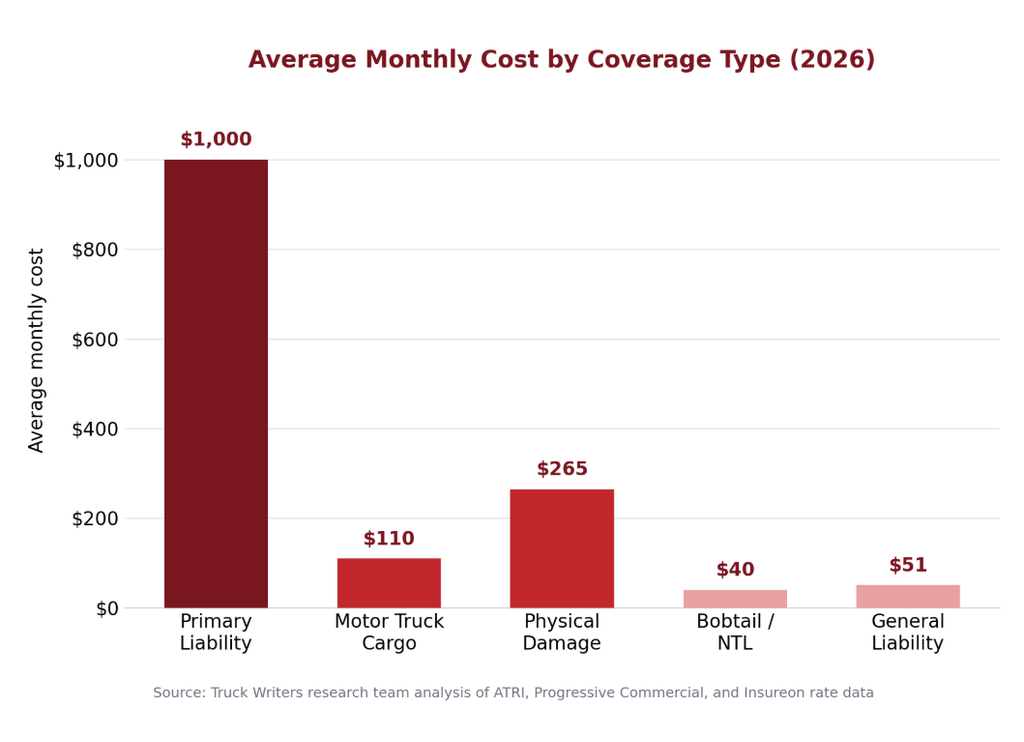
Primary liability alone makes up 55% to 65% of what you pay for a full program. It’s also the fastest-growing line item. Cargo and general liability barely move year to year unless your freight mix changes.
Average Monthly Cost by Fleet Size: 2026
The table below shows the per-truck cost at three common fleet sizes.
| Fleet Size | Average Monthly Cost Per Truck | Typical Coverage Stack | What Drives the Cost |
|---|---|---|---|
| Owner-Operator (1 truck, own authority) | $900 – $1,800 | Liability, cargo, physical damage | Full underwriting weight falls on one driver’s record; thin claims history; no negotiating leverage. Leased-on operators carrying only bobtail and physical damage pay closer to $250 – $500 |
| 2–5 Trucks | $800 – $1,400 | Liability, cargo, physical damage, often GL | Priced close to “owner-operator plus”; one claim can still swing a renewal hard; safety documentation starts to matter |
| 6–20 Trucks | $750 – $1,200 | Full program plus general liability, sometimes umbrella | More predictable loss history across trucks; multi-unit negotiating leverage; telematics and dash cam discounts of 5% to 10% |
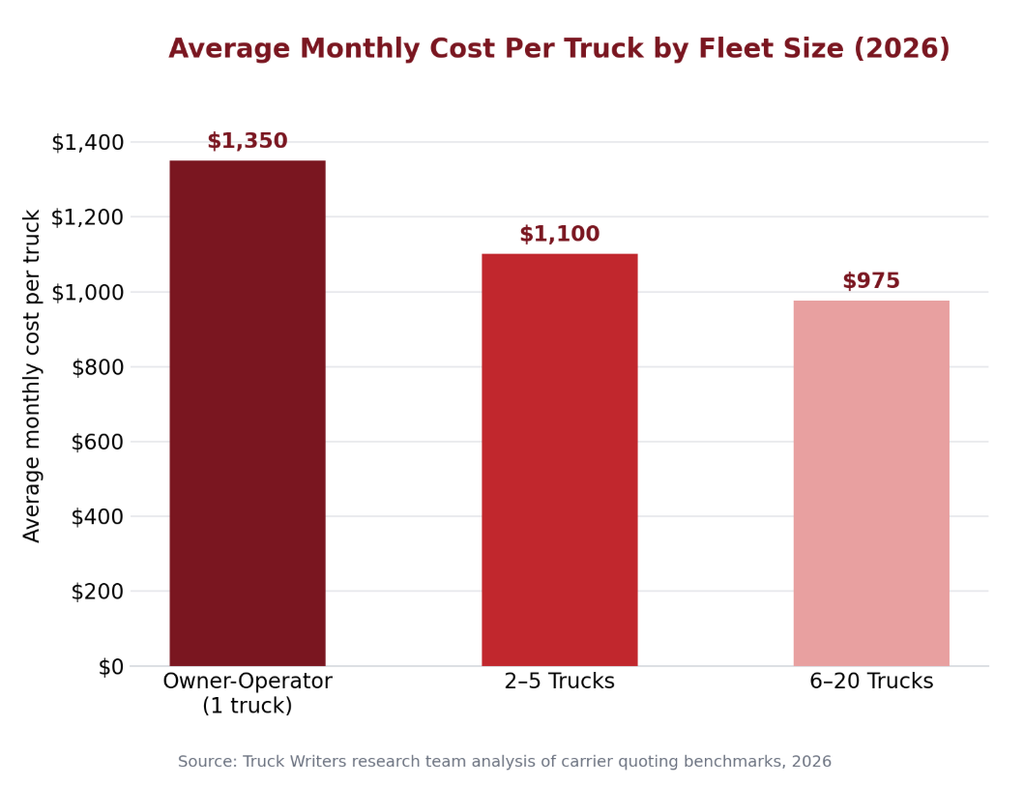
Operators running 1 to 5 trucks see the widest range of quotes in this data. With less claims history on file, individual factors like driver tenure carry more weight. Cross the 6-truck mark with a stable driver roster and a documented hiring process, and renewal terms tend to improve.
Average Monthly Cost by Vehicle Type
The table below shows average monthly cost for a full coverage package across five common vehicle types.
| Vehicle Type | Average Monthly Cost (Full Package, Established) | What Drives the Cost |
|---|---|---|
| Semi-Truck (Dry Van) | $665 – $1,600 | Highest liability exposure by weight and value; the most common cargo class; the baseline other vehicle types get priced against |
| Box Truck | $500 – $909 | Lower gross vehicle weight; usually local or regional routes; lower cargo value; often qualifies for FMCSA’s $300,000 minimum instead of $750,000 |
| Flatbed | $750 – $2,000 | Open-deck load-shift and weather exposure; frequent cargo securement claims; higher-value commodities like steel and machinery |
| Tanker | $817 – $1,833 | Higher required liability limits, up to $5,000,000 for hazmat loads; rollover and spill severity; specialized cargo handling |
| Refrigerated (Reefer) | $1,000 – $1,800 | Required refrigeration breakdown coverage; spoilage claims; mechanical failure risk; higher-value perishable freight |
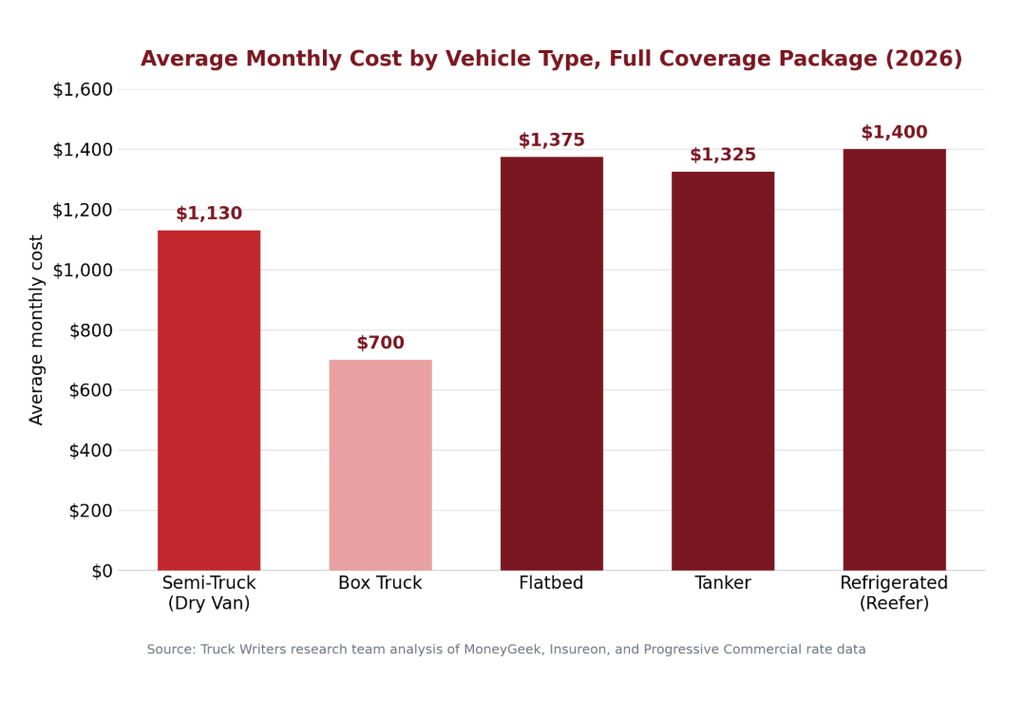
Box trucks are the clear outlier on the low end, largely because most run shorter, local routes with lower cargo values. Flatbed, tanker, and reefer trucks all price above standard dry van, each for a different reason: flatbeds for load-shift risk, tankers for liability severity, reefers for spoilage exposure.
Average Monthly Cost by Driver Profile
The table below compares how both the driver factor and profile impact the cost amongst the baseline.
| Driver Factor | Profile | Cost Impact vs. Baseline | Cost Driver |
|---|---|---|---|
| Experience | New CDL holder (under 2 years) | +40% to +100% (often $1,500 – $2,500/month for new authority) | Limited safe-driving track record; many carriers won’t write a policy under 2 years |
| Experience | 2–5 years experience | Baseline to +15% | Still building a claims and safety history |
| Experience | 5+ years, clean record | -10% to -20% below baseline | Proven safe-driving record; 3+ years of clean operation qualifies for standard-market pricing |
| CDL Class | Class A (combination vehicles) | Standard baseline | Covers semi-trucks and combination vehicles over 26,001 lbs.; highest liability exposure class |
| CDL Class | Class B (straight trucks, box trucks) | Typically 10% to 20% below Class A | Smaller vehicles; lower liability exposure; usually local or regional operation |
| Violations | Clean record (0 violations, 3 years) | Baseline | Qualifies for standard-market carriers and the most competitive rates |
| Violations | 1 minor violation | +10% to +20% | A single moving violation under 20 mph over the limit |
| Violations | Multiple minor violations | +30% to +50% | Cumulative surcharge from repeated infractions |
| Violations | Major violation (reckless driving, DUI, 20+ mph over) | +200% to +500% | Forces placement into a high-risk insurance market |
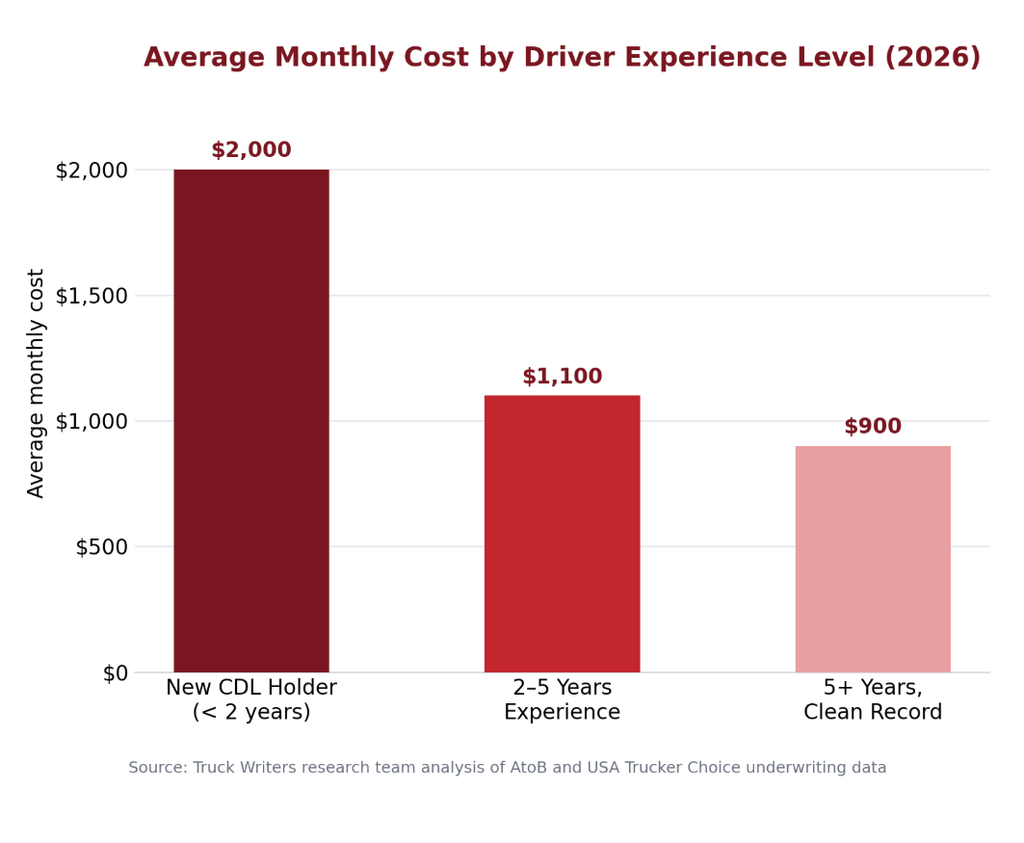
Insurers price the driver before they price the truck. A new driver with even one violation gets hit twice: once for inexperience, once for the violation. That combination explains why new authorities without a clean multi-year record end up with the highest quotes in the market.
Trucking Insurance Cost by Month from 2024 to 2026
The table below anchors the report by comparing costs from the start of 2024 to what currently stands in 2026. It tracks the coverage type, fleet size, vehicle type, and driver profile above.
| Month | Avg. Cost Per Mile | Avg. Monthly Premium |
|---|---|---|
| Jan 2024 | $0.100 | $850 |
| Feb 2024 | $0.100 | $853 |
| Mar 2024 | $0.101 | $856 |
| Apr 2024 | $0.101 | $858 |
| May 2024 | $0.101 | $861 |
| Jun 2024 | $0.102 | $864 |
| Jul 2024 | $0.102 | $867 |
| Aug 2024 | $0.102 | $870 |
| Sep 2024 | $0.103 | $873 |
| Oct 2024 | $0.103 | $876 |
| Nov 2024 | $0.103 | $879 |
| Dec 2024 | $0.104 | $881 |
| Jan 2025 | $0.104 | $884 |
| Feb 2025 | $0.104 | $887 |
| Mar 2025 | $0.105 | $890 |
| Apr 2025 | $0.105 | $892 |
| May 2025 | $0.105 | $895 |
| Jun 2025 | $0.106 | $898 |
| Jul 2025 | $0.106 | $901 |
| Aug 2025 | $0.106 | $904 |
| Sep 2025 | $0.107 | $907 |
| Oct 2025 | $0.107 | $910 |
| Nov 2025 | $0.107 | $913 |
| Dec 2025 | $0.108 | $915 |
| Jan 2026 | $0.108 | $920 |
| Feb 2026 | $0.109 | $924 |
| Mar 2026 | $0.109 | $928 |
| Apr 2026 | $0.110 | $932 |
| May 2026 | $0.110 | $937 |
| Jun 2026 | $0.111 | $941 |
| Jul 2026 | $0.111 | $945 |
| Aug 2026 | $0.112 | $949 |
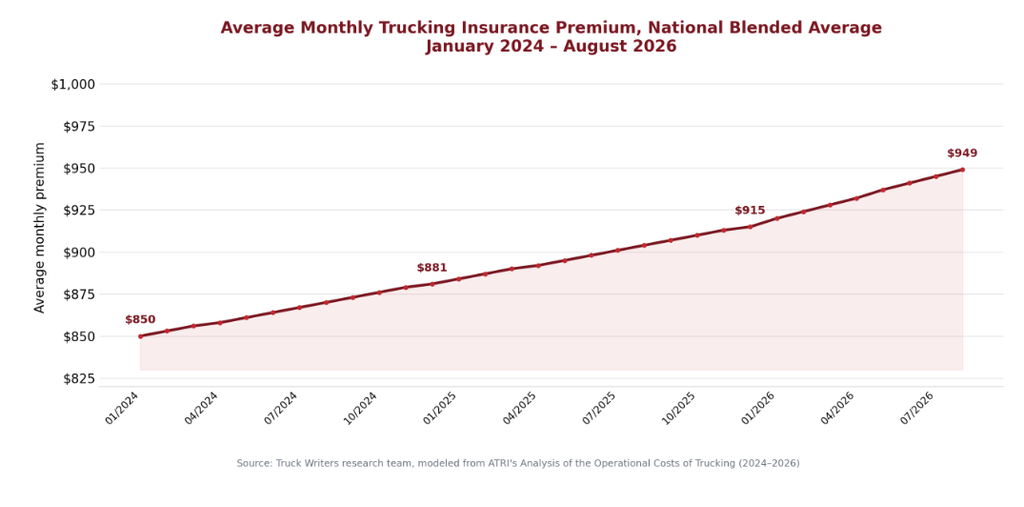
Insurance costs have climbed every month tracked in this table. The modeled national average monthly premium rose from $850 to $949 over the whole duration, an 11.6% increase. That growth is steady, not sudden, which matches what ATRI reported at the annual level: premiums rose 3.0% in 2024 and 3.9% in 2025. The cause isn’t more accidents as crash rates have fallen for three straight years, rather the verdict size. The median nuclear verdict hit $51 million in 2024, up from $44 million in 2023 and just $21 million in 2020. The number of nuclear verdicts against corporations jumped 52% in a single year.
Conclusion
Costs are rising across every category in this report: coverage type, fleet size, vehicle, and driver record. Primary liability is both the biggest expense and the fastest-growing one, and courtroom verdicts, not conditions on the road, are driving it. Fleet size and driver experience are the two factors you can actually control. Carriers with a documented safety program, drivers who stay past the 3-year mark, and a clean multi-year loss history consistently land in the lower half of every range in this report. New authorities and drivers under 2 years sit at the top end. If per-mile costs keep climbing through the rest of 2026 the way they have so far, a clean driver and safety record will matter to your bottom line as much as fuel costs or freight rates do.
Contact Truck Writers to get a quote based on your fleet size, vehicle type, and driving record.
Sources
- Truck Writers Research Team. Truck Writers. Blaine, MN. August 2026.
- American Transportation Research Institute (ATRI). “An Analysis of the Operational Costs of Trucking: 2026 Update.” Arlington, VA. July 15, 2026. https://truckingresearch.org/about-atri/atri-research/operational-costs-of-trucking/
- Federal Motor Carrier Safety Administration (FMCSA). “Insurance Filing Requirements.” U.S. Department of Transportation. https://www.fmcsa.dot.gov/registration/insurance-filing-requirements
- Progressive Commercial. “Commercial Truck Insurance: Get a Quote.” November 27, 2025. https://www.progressivecommercial.com/commercial-auto-insurance/truck-insurance/
- Insureon. “Commercial Truck Insurance Costs: Get Free Quotes.” June 23, 2025. https://www.insureon.com/trucking-business-insurance/cost
- The Zebra. “Commercial Auto Insurance.” May 13, 2026. https://www.thezebra.com/small-business-insurance/commercial-auto-insurance/
- American Trucking Associations (ATA). “How Nuclear Verdicts are Strangling America’s Trucking Industry.” https://www.trucking.org/news-insights/how-nuclear-verdicts-are-strangling-americas-trucking-industry