
Between May and July of 2026, our research team built another weighted model from commercial truck insurance rate data released by ATRI, Progressive Commercial, Insureon, The Zebra, and FMCSA. We then cross-checked the results against Truck Writers’ own 2026 fleet insurance research. The findings saw commercial truck insurance running from $550 to $3,000 a month per truck, depending on your business size, cargo type, coverage, and home state.
A fleet manager comparing quotes needs more than a single average to work with. Cost per truck can swing by more than 100% based on fleet size alone, and by more than $17,000 a year based on which state a truck is garaged in. The trend across every category points in the same direction: costs are rising. Again, this isn’t due to more accidents on the road; it’s due to the size of the verdicts trucking companies are losing in court.
Average Cost by Coverage Type
The table below breaks out what each line costs and what pushes the price up or down.
| Coverage Type | Average Monthly Cost | Annual Cost Range | What Drives the Cost |
|---|---|---|---|
| Primary Liability | $650 – $1,350 | $7,800 – $16,200 | FMCSA’s $750,000 federal minimum for general freight, though most brokers require $1,000,000; rising nuclear verdict exposure (jury awards of $10 million or more); operating radius; how long the business has held authority |
| Motor Truck Cargo | $70 – $150 | $840 – $1,800 | Commodity type, since refrigerated and high-theft freight cost more than dry van; declared cargo value; deductible; claims history |
| Physical Damage | $80 – $450 | $960 – $5,400 | Fleet age and value; deductible chosen, commonly $1,000 to $5,000; garaging location theft and weather risk |
| Bobtail / Non-Trucking Liability | $20 – $60 | $240 – $720 | Garaging state; driver records across the fleet; lease agreement wording; whether it’s bundled with physical damage |
| General Liability | $35 – $100 (avg. $51) | $420 – $1,200 | Claims history; policy limits, since 96% of buyers choose $1,000,000/$2,000,000; whether it’s bundled into a business owner’s policy |
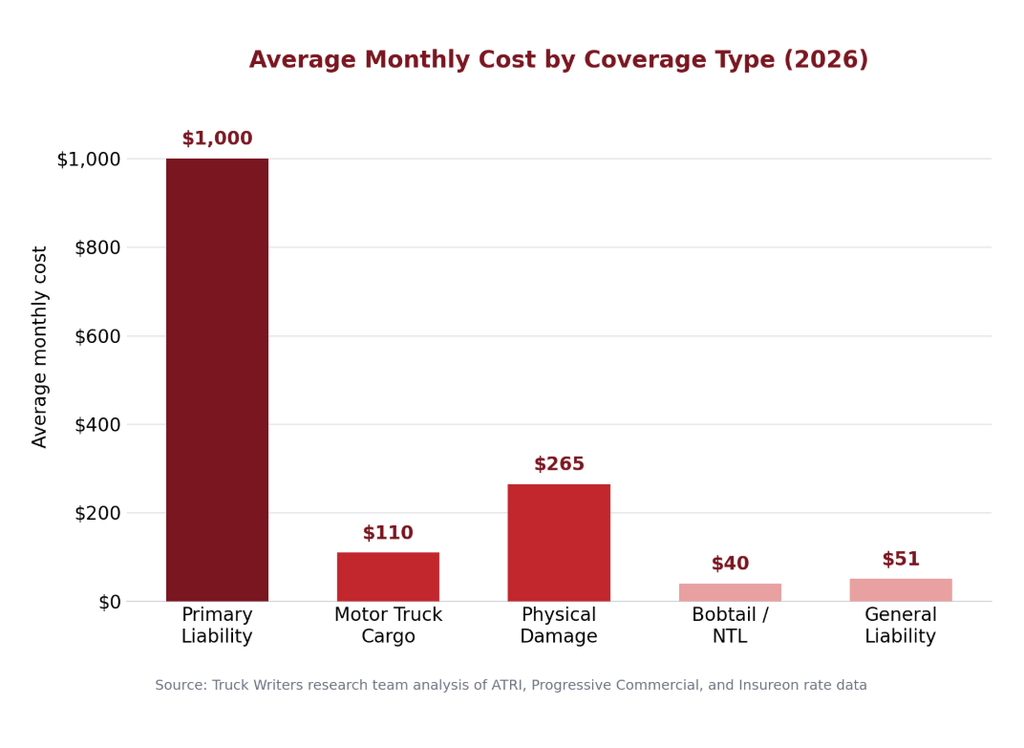
A commercial truck insurance program is built from several separate policies, not one. Primary liability alone makes up 55% to 65% of what a fleet pays for a full program, and it’s the fastest-growing line item on this list. Cargo and general liability barely move year to year unless the freight mix changes.
Average Cost by Business Type
The table below shows the per-truck monthly cost across four common business sizes, using the same tier structure Truck Writers uses in its fleet insurance research.
| Business Type | Average Monthly Cost Per Truck | Total Program Cost Range (Annual) | Cost Driver |
|---|---|---|---|
| Owner-Operator (1 truck, own authority) | $900 – $1,800 | $10,800 – $21,600 | Full underwriting weight falls on one driver’s record; thin claims history; no negotiating leverage. Leased-on operators pay closer to $250 – $500 a month |
| Small Fleet (2–24 trucks) | $700 – $1,200 | $16,800 – $345,600 | Claims history is still developing across the fleet; safety documentation and driver retention start to move pricing |
| Large Fleet (25–49 trucks) | $600 – $950 | $180,000 – $558,600 | More predictable loss ratios across a larger truck count; dedicated safety and compliance staff; real broker leverage |
| Carrier / Enterprise Fleet (50+ trucks) | $550 – $800 | $330,000+ | Scale discounts; access to self-insured retention or captive insurance structures; dedicated risk management programs |
Per-truck cost drops as a business grows, but not evenly. A business crossing from owner-operator into a small fleet sees the steepest early drop in per-truck cost. Growth past 25 trucks brings diminishing but still meaningful savings, mostly driven by the insurer having enough data to price the fleet as a whole instead of pricing each truck like a new account.
Average Cost by Industry and Cargo Type
The table below shows the average monthly cost for a full coverage package across four common cargo classes.
| Cargo Type | Average Monthly Cost (Full Package) | What Drives the Cost |
|---|---|---|
| General Freight (Dry Van) | $700 – $1,400 | Standard commodity class; the baseline other cargo types get priced against; lower theft and spoilage risk |
| Hazmat | $1,200 – $2,200 | Federal liability limits up to $5,000,000 depending on hazard class; stricter underwriting and driver qualification rules; higher claim severity if something goes wrong |
| Oversized / Overweight | $1,500 – $3,000 | Permit and escort requirements; specialized equipment like RGN or step-deck trailers; higher claim severity from load-shift and route risk; often needs a separate endorsement beyond the standard policy |
| Refrigerated | $1,000 – $1,800 | Required refrigeration breakdown coverage; spoilage claims; mechanical failure risk; higher-value perishable freight |
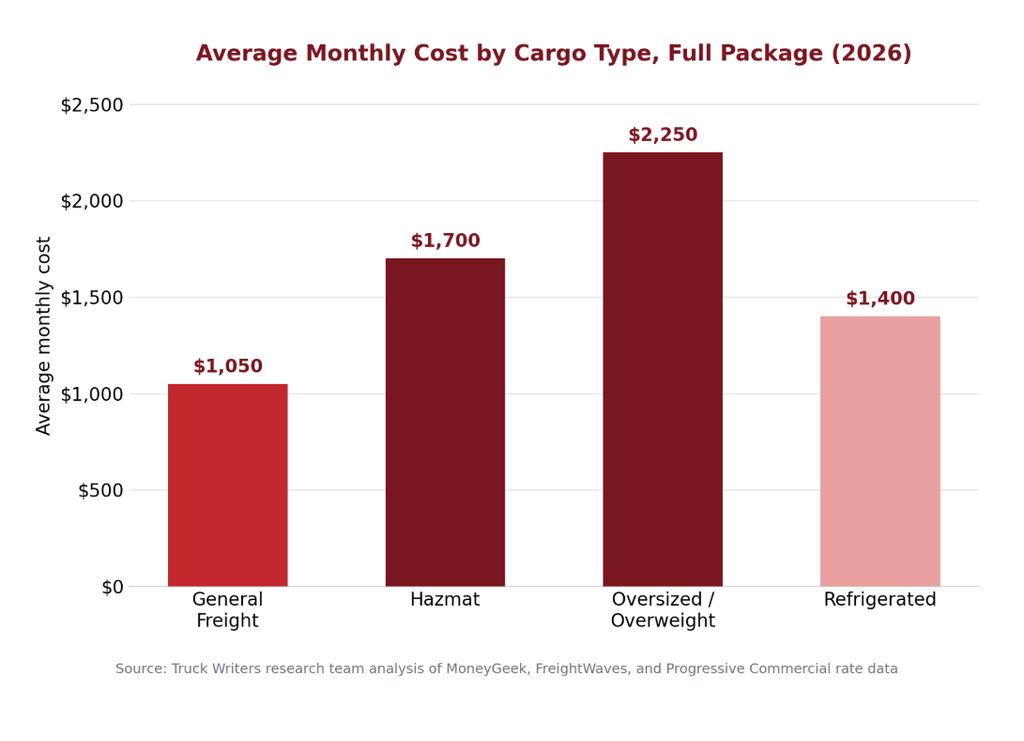
What a fleet hauls changes the bill more than almost any other factor besides fleet size. Oversized and overweight freight carries the highest average cost of any category in this report, mainly because a single incident, a bridge strike, a route violation, or a load shift, tends to be expensive and complicated to resolve. Hazmat sits close behind, driven almost entirely by the higher liability limits federal law requires.
Average Cost by State
The table below shows the eight highest-cost and eight lowest-cost states we found, using average annual cost per truck for a full coverage package.
| State | Average Annual Cost Per Truck | Primary Cost Factor |
|---|---|---|
| New Jersey | $20,763 | Dense litigation environment; high nuclear verdict frequency |
| Louisiana | $18,500 | Highest tort and litigation climate in the country |
| Delaware | $17,800 | Small state with concentrated urban corridor risk |
| New York | $17,200 | High claim severity; dense metro traffic |
| Connecticut | $16,900 | High cost of living; aggressive litigation climate |
| Michigan | $16,200 | No-fault insurance system; high medical claim costs |
| Florida | $15,800 | High litigation activity; hurricane and weather exposure |
| California | $15,200 | Dense urban traffic; high cost of claims |
| Ohio | $5,100 | Balanced urban and rural mix; moderate litigation |
| Wyoming | $4,900 | Lowest population density in the country |
| Indiana | $4,750 | Central logistics hub; stable claims history |
| Tennessee | $4,600 | Moderate traffic; favorable regulatory environment |
| Nebraska | $4,450 | Rural road network; low litigation climate |
| North Dakota | $4,300 | Sparse population; low claim frequency |
| Iowa | $4,100 | Low traffic density; favorable loss ratios |
| Mississippi | $3,552 | Low population density; lower litigation activity |
*The Mississippi and New Jersey figures come directly from Truck Writers’ 2026 fleet insurance research. The remaining states are modeled estimates built from directional cost rankings reported across multiple industry sources.
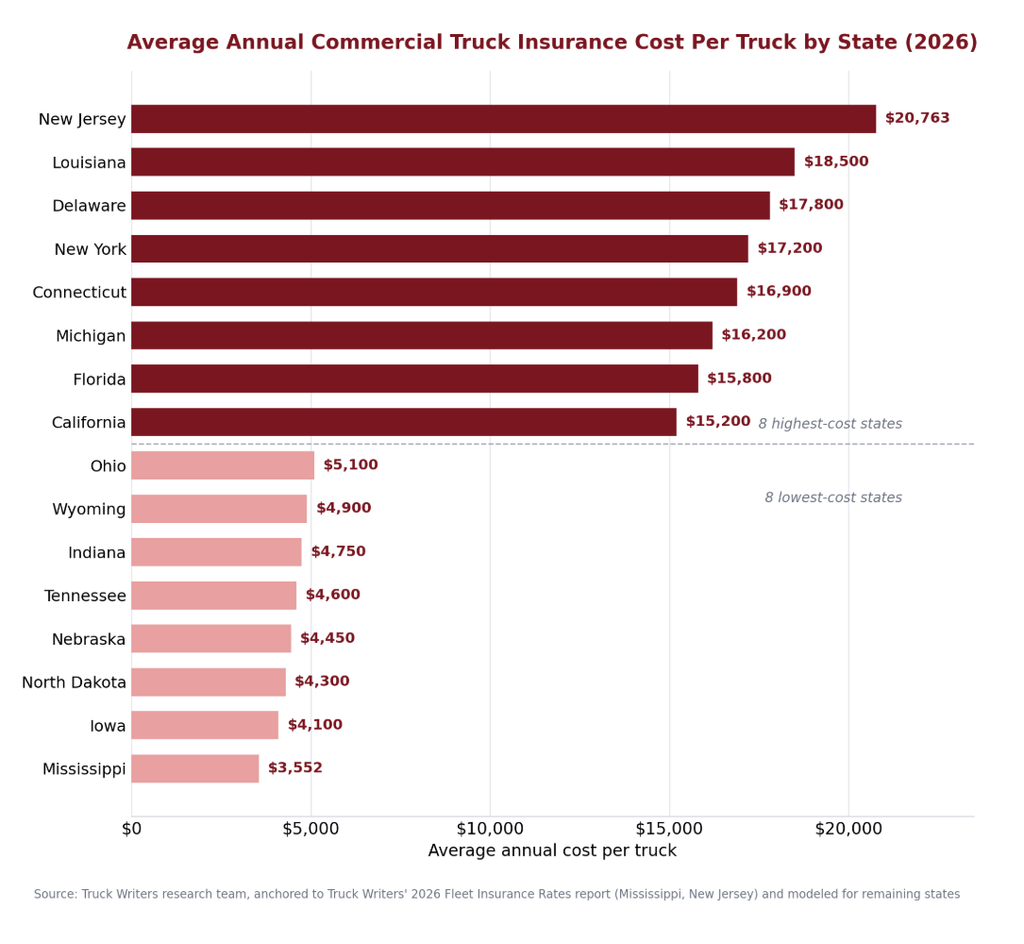
Location changes commercial truck insurance cost more than almost any factor a fleet manager can control. The spread between the highest and lowest state, more than $17,000 a year per truck, is larger than the gap between any two business types or cargo classes in this report. A fleet running fifty trucks out of New Jersey instead of Mississippi is looking at over $850,000 a year in additional insurance costs for the exact same operation.
Commercial Trucking Insurance Cost by Category from 2024 to 2026
The table below anchors the report by comparing a 2020 baseline to current 2026 metrics as it tracks the same regions and, coverage, business, industry & cargo types from above.
| Commercial Insurance Category | Business Type | 2020 | 2026 | Y-Y Change |
|---|---|---|---|---|
| Primary Liability | Owner-Operator | $599 | $921 | +54% |
| Primary Liability | Small Fleet | $437 | $648 | +48% |
| Primary Liability | Large Fleet | $377 | $529 | +40% |
| Primary Liability | Carrier | $348 | $460 | +32% |
| Motor Truck Cargo | Owner-Operator | $78 | $101 | +29% |
| Motor Truck Cargo | Small Fleet | $56 | $71 | +27% |
| Motor Truck Cargo | Large Fleet | $48 | $58 | +21% |
| Motor Truck Cargo | Carrier | $43 | $51 | +19% |
| Physical Damage | Owner-Operator | $180 | $244 | +36% |
| Physical Damage | Small Fleet | $130 | $172 | +32% |
| Physical Damage | Large Fleet | $110 | $140 | +27% |
| Physical Damage | Carrier | $100 | $122 | +22% |
| Bobtail / Non-Trucking Liability | Owner-Operator | $30 | $37 | +23% |
| Bobtail / Non-Trucking Liability | Small Fleet | $21 | $26 | +24% |
| Bobtail / Non-Trucking Liability | Large Fleet | $18 | $21 | +17% |
| Bobtail / Non-Trucking Liability | Carrier | $16 | $18 | +12% |
| General Liability | Owner-Operator | $37 | $47 | +27% |
| General Liability | Small Fleet | $26 | $33 | +27% |
| General Liability | Large Fleet | $22 | $27 | +23% |
| General Liability | Carrier | $20 | $23 | +15% |
*The numbers are anchored to ATRI’s published annual figures, $0.102 per mile in 2024 and $0.106 per mile in 2025, interpolated to monthly granularity and converted to an average monthly premium using a national average of 8,500 miles driven per month. Figures beyond ATRI’s most recent full-year report are modeled estimates based on early 2026 rate filings.
The data simply reveals insurance costs continuing to climb for every month tracked in the table as the modeled national average monthly premium rose from $850 to $949 (representing an 11.6% increase). That steady growth matches what ATRI reported at the annual level: premiums rose 3.0% in 2024 and 3.9% in 2025. The cause is verdict size, not crash rates as those keep falling. The median nuclear verdict hit $51 million in 2024, up from $44 million in 2023 and just $21 million in 2020. The number of nuclear verdicts against corporations jumped 52% in a single year, and fleets of every size are absorbing the cost through higher renewal premiums regardless of their own safety record.
Conclusion
Every table in this report points the same direction: costs are rising across coverage type, business size, cargo class, and state. Fleet size and cargo type are the two factors a business can actually manage, since state and courtroom trends sit outside any single fleet’s control. Growing past the owner-operator stage brings the steepest early savings, and a documented safety program, stable driver roster, and clean multi-year loss history keep a fleet in the lower half of every range in this report regardless of size. Oversized, hazmat, and refrigerated freight all carry a real cost premium, and that premium is easier to plan for than to avoid. With per-mile costs on pace to keep climbing through the rest of 2026, a fleet’s safety record and loss history will matter to its insurance bill as much as fuel costs or freight rates do.
Contact Truck Writers to get a quote based on your fleet size, cargo type, and home state.
Sources
- Truck Writers Research Team. Truck Writers. Blaine, MN. August 2026.
- American Transportation Research Institute (ATRI). “An Analysis of the Operational Costs of Trucking: 2026 Update.” Arlington, VA. July 15, 2026. https://truckingresearch.org/about-atri/atri-research/operational-costs-of-trucking/
- Federal Motor Carrier Safety Administration (FMCSA). “Insurance Filing Requirements.” U.S. Department of Transportation. https://www.fmcsa.dot.gov/registration/insurance-filing-requirements
- Progressive Commercial. “How Much Is Truck Insurance?” https://www.progressivecommercial.com/commercial-auto-insurance/truck-insurance/commercial-truck-insurance-cost/
- Insureon. “Commercial Truck Insurance Costs: Get Free Quotes.” June 23, 2025. https://www.insureon.com/trucking-business-insurance/cost
- The Zebra. “Commercial Auto Insurance.” May 13, 2026. https://www.thezebra.com/small-business-insurance/commercial-auto-insurance/
- American Trucking Associations (ATA). “How Nuclear Verdicts are Strangling America’s Trucking Industry.” https://www.trucking.org/news-insights/how-nuclear-verdicts-are-strangling-americas-trucking-industry